


Trading is one of many ways you can now earn money remotely with your laptop/phone and an internet connection. Gone are the days where you’re limited to working a 9-5 job you hate, for a boss who doesn’t appreciate you.
With trading, you can earn on your own terms and live anywhere in the world. I’m writing this from my condo in Thailand, which is about 5 minutes from the beach.
With unelected organizations like the WEF attempting to dictate policy through their strategically placed proxies in governmental positions, becoming financially and location independent is more important than ever.
Don’t want to go into a lockdown during the next “pandemic”? Pick up your laptop and leave.
Don’t want your employer making medical decisions for you? Then keep reading, learn how to do this and you may not need an employer at all.
Alright, let’s get into it..
I’m going to assume that you have at least a basic level of knowledge when it comes to buying crypto, sending & receiving crypto, and using an exchange. If you don’t, click on those hyperlinks when you’re done reading this article as they’ll walk you through the basics.
The Nomad AutoTrade System
In order to follow this method, you’re going to need accounts on a few platforms.
Required tools of the trade (pun intended)
- An account on TradingView, which is the most popular charting platform. You can sign up here for free, but if you decide to upgrade to a paid plan, that link will get you a $30 discount.
- An account on a crypto exchange. I personally like this one the best. The trading fees are low, it’s easy to use and the features are incredibly useful.
- You’ll also need these premium indicators, which will give you the buy/sell signals. You can use the code “LUX30” for 30% off.

Yes, it’s going to take a small investment to get the indicators required for this. If you try and you’re not happy with them, you can just cancel (and even get a refund if you use them for less than 30 days). I doubt you’re going to want to do that though. Their discord group is full of people who are asking to be able to purchase lifetime memberships.
How to set up your charts
On TradingView (sign up for an account here), you can add up to 3 indicators using the free plan. To add them, look for the “indicators” tab, them type in “LUX”. Doing so will pull up a few dozen options, but the ones you want are the top 3 premium ones (they’re premium for a reason).

Before you’ve purchased a LUX membership, you’ll be able to see the indicators in the drop down menu, but you won’t have access. Once you’ve purchased a membership (here), your TradingView account username will be green-lighted and you’ll be able to add them to your chart.
Here are the indicators you’ll be using for the method..
Ultimate Stochastic: The LuxAlgo Oscillators (Premium) consists of 5 different indicators, my favourite of which is the Stochastic. It’s much cleaner and easier to read than the typical stochastic indicators that are available for free. Here’s what it looks like..
Note: They have recently updated their premium indicator, but you can still get this stochastic by requesting it in their Discord group. Just say you want the “version 5 ultimate stochastic”.
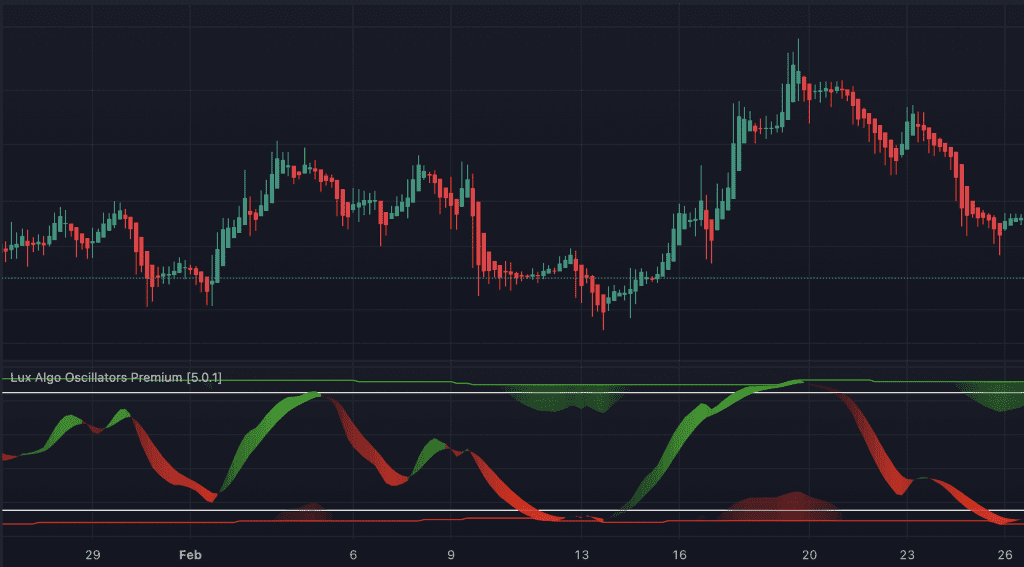
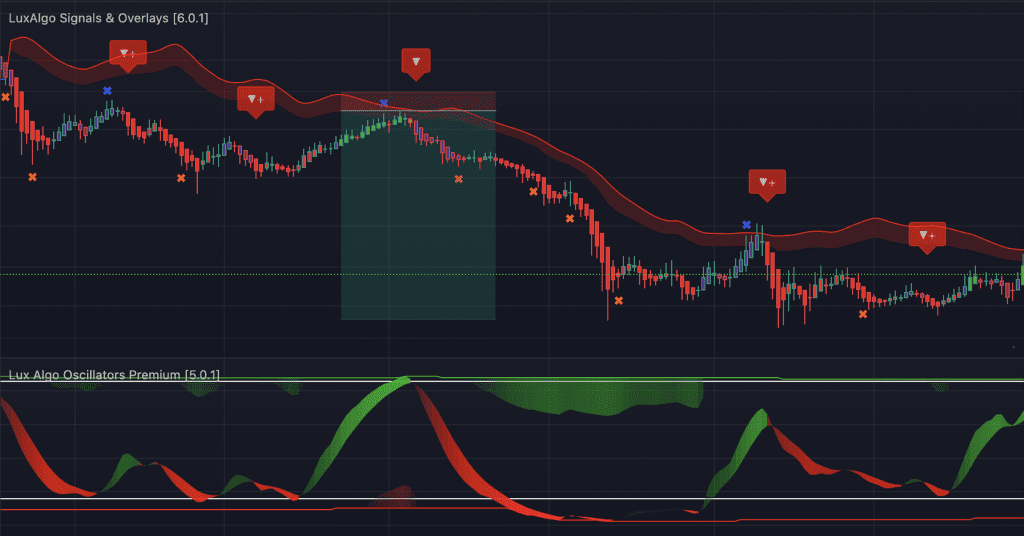
Now, while the stochastic is a lagging indicator (meaning that it trails the price action), I find it very useful for predicting the cyclical rhythm of the market. See the beige colour horizontal lines running across the top and bottom? I mark those regions out at the 85 and 15 level.
Let’s see what happens if we were to take trades as the stochastic reaches those regions and changes from green to red, or vice versa..
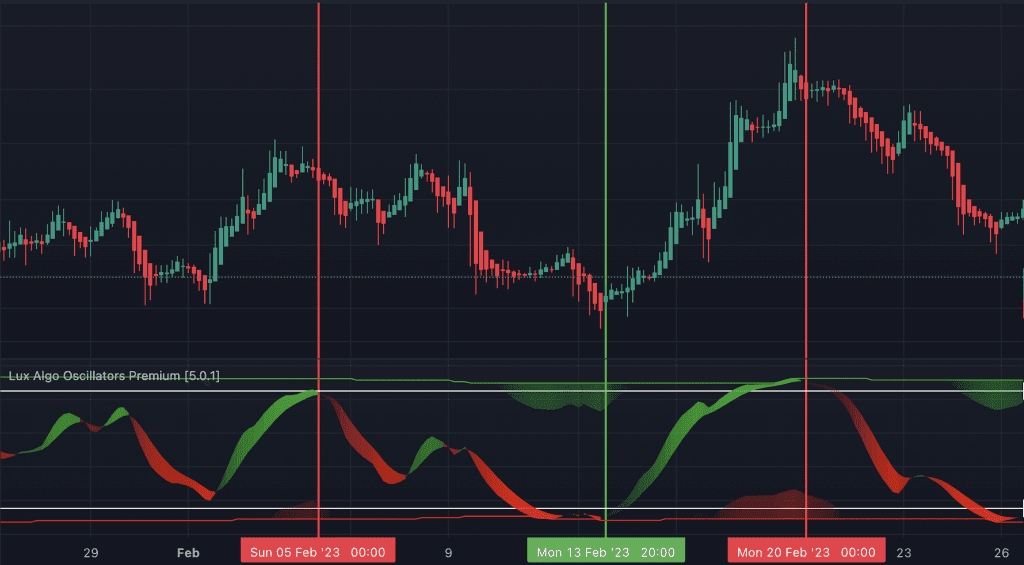
Not bad, huh? Using nothing else but the LUX stochastic indicator, it’s possible to lock in relatively consistent profits by trading based off those extreme regions.
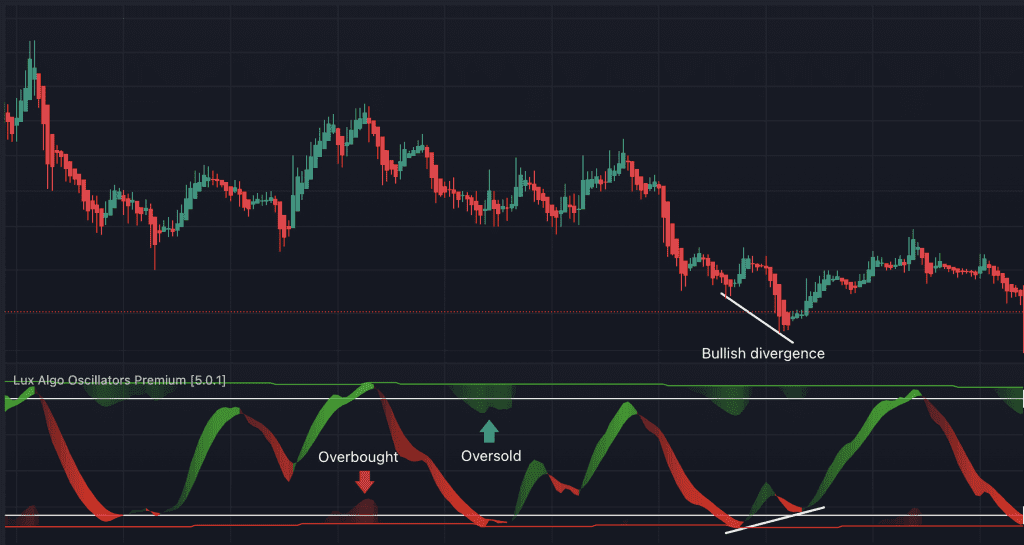
If you’re wondering what the mounds of green and red are, they’re meant to show overbought and oversold regions, however, I don’t pay much attention to those and instead focus on the colour change around the 85 and 15 level.
I do however pay attention to divergences. If you don’t know what those are, then this is the article you should read after this.
Alright, so once you’ve added the LUX ultimate stochastic indicator to your charts, the next step will be to add “LuxAlgo signals and overlays (premium)”, which is the most popular paid indicator in existence.
Signals and Overlays: This is a feature packed indicator bundle. Once you have it, I suggest playing around with all that it has to offer, but for this particular strategy, there are just a few features that we’re going to implement as to not over-clutter our charts.
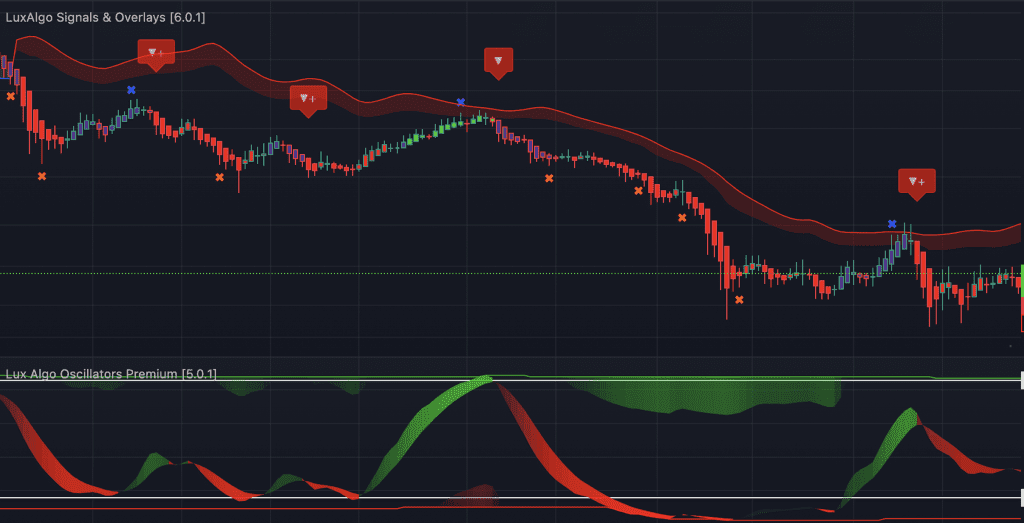
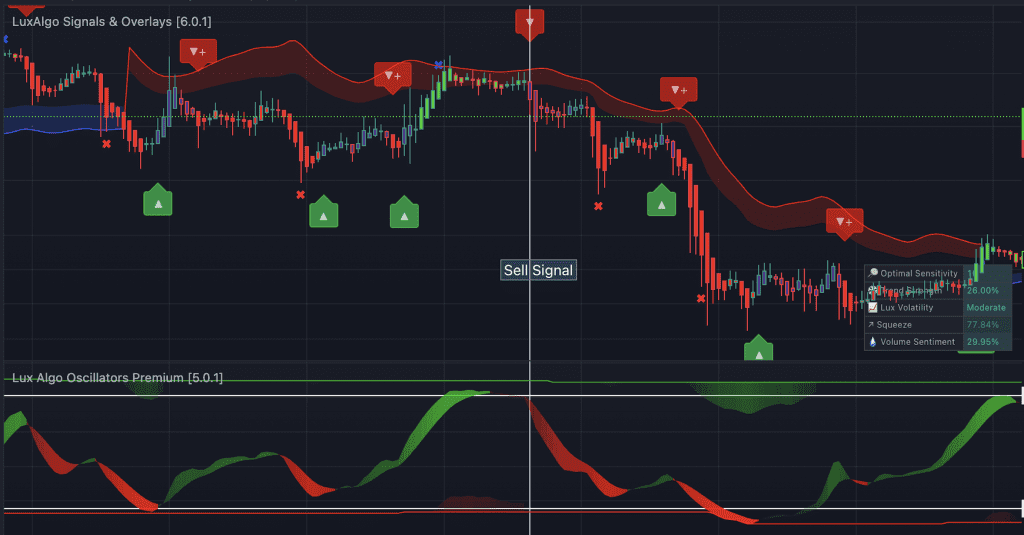
The first is the buy/sell signals. They used to say “buy” “sell” and “strong”, but after a recent update, they now just display arrows. Here’s what they look like when added to the chart..

Notice the dashboard in the lower right corner? That will give you some very useful information pertaining to the trend strength, volume and various other factors. However, the most important piece of data to pay attention to on the dashboard is the “optimal sensitivity” value. If it shows 11 (as it does in the above screenshot), then you’ll need to set the signals sensitivity to 11 via the “inputs” tab in the settings. Doing so will give you more accurate signals.
Now, these buy/sell signals on their own can be quite accurate at times, however, they’re definitely not meant to be used alone. Rather, they should be used in conjunction with other indicators and price action for confluence. There are ways to disqualify signals that are likely to be false, while prioritizing the ones that have a higher probability of being reliable.
One way to do this is to add the “smart trail” to your chart.
Smart Trail: The smart trail is a useful indicator that can be accessed within the settings of the LUX signals and overlays set. To add it, look for the gear icon (which will bring up the settings menu), then check “smart trail” under the indicator overlay section.

Once you add the smart trail to your chart, it will help you visually identify the direction of the trend. Another benefit is that it acts as a dynamic support and resistance level. When you start using it, you’ll notice that the price oftentimes bounces off of it, which can be used to your advantage.
Here’s what it looks like..

As you can see, in this example, the price found support and bounced off the blue line twice during the uptrend, and during the downtrend (which is indicated by the switch to red), the price got rejected hard as it came up to test the resistance.
Putting It Together
Alright, so now that we’ve covered the basics of the “ultimate stochastic”, the buy/sell signals and the “smart trail”, we can combine them to get more powerful signals.
Remember, when trading, you want to look for confluences. What that essentially means is that you ideally want multiple signals to align and tell the same story.
This “story” can be told using support/resistance levels, patterns, moving averages, candlestick formations, and, of course.. indicators like the ones discussed in this article.
To give you an example of confluence, take a look at the chart below..
Now, this doesn’t happen often, but take a look at the sell signal in the middle of the chart. Is that a trade you’d take based on what you’ve read throughout this article?
- The stochastic is crossing down and changing colours from an overbought region of 85+.
- The smart trail is red, which indicates a downtrend, and the price has approached it from below.
- A sell signal gets printed on the chart.
Now, each of these sell signals can potentially work out on their own, but when they all occur at the same time (in “confluence”), it has a much higher chance of working out in your favour.
In the example above, if you had entered a short position as the price neared the smart trail, you could have placed a stop loss slightly above the red resistance line (to minimize your risk), while giving yourself the opportunity to reap a massive reward if the price crashed – which it did.
That’s really the key to trading. You want to look for entries that offer a good risk/reward ratio. Meaning, you want to enter your long (buy) positions near support levels, and you want to enter your short (sell) positions near resistances.
If you’re wrong, that’s fine. You’ll be able to quickly identify when the trade has moved against you if the price breaks through those levels, and you’ll be able to exit without taking too big of a loss.
There’s a tool in Tradingview you can use to make these calculations. To find it, look for “prediction and measurement tools” along the sidebar to the left of your chart.
Familiarize yourself with those tools because you’ll likely be using them often.
In the example above, had you stayed in the trade for the entirety of the move, you would have had about an 1:8 risk to reward ratio assuming you placed your stop loss slightly above the resistance from the smart trail.
That being said, you would have likely closed partial positions of your trade as the price was dropping as the “x” indicates areas where you should lock in some profits.
Anyway, now that you now know how these indicators work, and how to use them in confluence – let’s get into the rules of the strategy.
System rules
1) Start by looking at the high timeframes and do a “big picture” analysis. Pay attention to the trend direction, and note the major support/resistance levels based on market structure.

In the above example using the weekly chart, I was able to identify that the price is consolidating in a bull flag formation after breaking above a resistance set by a long term trendline.
That being said, the price is currently battling a horizontal resistance level that used to be a long term support (broken support turns to resistance, and vice versa).
The smart trend has flipped bullish (indicated by the blue smart trail), and we’ve been shown a green buy overlay that almost perfectly called the bottom of the bear market.
So, based on this, my bias would be bullish for the long term. I would get even more bullish if the price breaks up from the bull flag (which is statistically likely), and starts closing candles above the horizontal resistance line.
Once you’ve analyzed the market on the higher timeframes (weekly, daily), you can then use shorter timeframes for your entries and exits (assuming you want more activity). You can trade off the long timeframes as well (which is known as “swing trading), but you won’t be placing many trades as the signals will be very spaced out.
2) On your preferred timeframe, look for your entry and exit signals. As you can see from the chart examples, the overlay indicator provides a lot of buy/sell signals. I wouldn’t suggest taking them all. Instead, focus on the ones that have the highest likelihood of working out.
As mentioned, to identify these setups, you’ll want to look for confluence. Here are 3 setups I personally like to take, ranked in order of how I prioritize them.
3 Trade Setups
1) Trade Setup #1 (Conviction rating = 9/10): The highest conviction setup using these indicators is the one I’ve shown above. Here’s another example of it..
As you can see, the sell signal triggers as the price reaches the (red) smart trail resistance. This happens while the stochastic oscillator changes to red and starts moving down from the overbought (85+) region.
When you see this occurring, act on the signal and if the price breaks and closes a candle above the smart trail resistance, you can close the trade at a small loss. Trade setups that offer a nearby invalidation point are ideal for risk management and capital preservation.
If the price moves to the downside however, use the “x” to close a portion of your trade and lock in some profits. A common strategy after locking in partial profits would be to put a stop loss at break even. You could set up a trailing stop loss as well.
An equally optimal setup would be the same thing, but in reverse. Here’s an example..
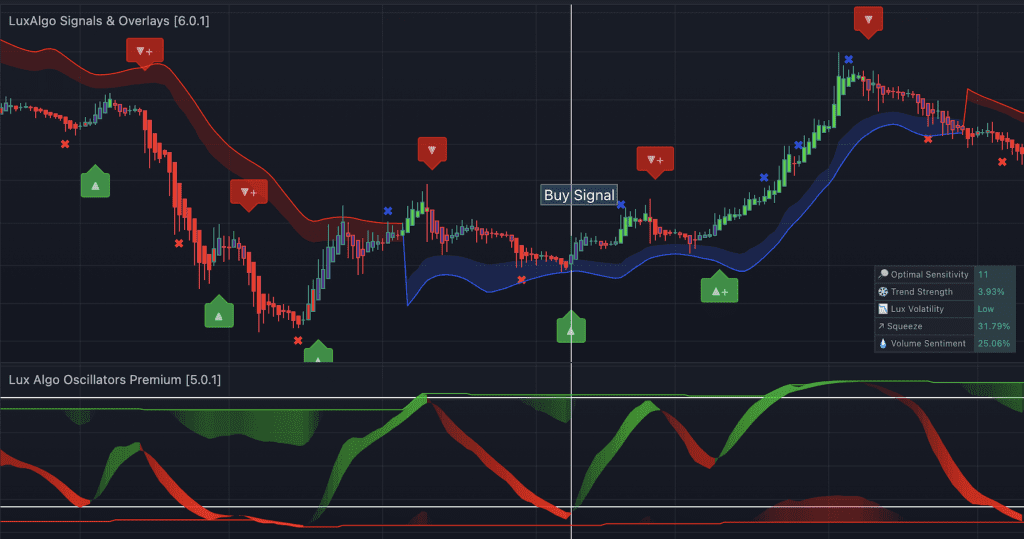
Since the setup remains the same, the rules remain the same as well. Enter the trade as you get a buy signal, the price bounces off the (blue) smart trail support and the stochastic starts to change colour and crosses back up from the oversold level of 15. The invalidation point for the trade would be if the (blue) smart trail support gets broken via a candle close.
2) Trade Setup #2 (Conviction Rating = 8/10): The next trade setup I look for is a lot more common. Essentially I look for bounce plays off the smart trail support/resistance. The difference, however, is that I prioritize the buy/sell signals that have the “+” symbol next to them. I also don’t require the stochastic to be overbought or oversold as a criteria for entering.
Obviously, with these entries/exits being much more common, with less strict entry criteria, the win rate percentage isn’t going to be as high as the previous setup example.
That being said, they’re still worth taking in my opinion because I can utilize a tight stop loss since I’m only buying near support/resistance levels. If that level breaks, I know quickly to exit the trade.

Trade Setup #3: (Conviction Rating 7/10): This setup is similar to the #1 high conviction play, but the main difference is that you’ll be trading against the trend.
There are 3 criteria for entering, and they all must be met before taking the trade.
- The first is a buy or sell signal (ideally one that has a “+” symbol).
- The second is for the stochastic to be turning over from overbought or oversold regions (15 or 85)
- The third is for the price to be relatively extended from the smart trail
Now, since you’ll be entering against the trend, you need to be extra cautious. Keep a tight stop loss slightly above the recent high, and target the smart trail as a take-profit area.
Here’s an example of what the setup looks like..

Remember, don’t get greedy when placing trades against the trend. Get in, and get out. There’s a saying that most experienced traders are familiar with..
“The trend is your friend.. till the end”
Until proven otherwise, you should assume that the trend direction will continue.
This is why the price being extended from the smart trail is one of the criteria for entry.
If the price is near the smart trail, and you’re entering a counter-trend position, the risk/reward ratio wouldn’t be worth it.
In the example above, if you place your stop loss slightly above the high (near where the sell signal is), and you target the smart trail as your take profit area, you’d get a favourable risk to reward ratio. This is because the distance to the take profit target is about twice as far as the distance to your stop loss.
Summary
I know this was a long article. If you made it this far, I hope you give it a try and let me know how it works out for you.
Here’s a review of the most important points..
- You’re going to need premium indicators and a tradingview account.
- Mark out overbought and oversold regions on the ultimate stochastic indicator at 85 and 15
- Add the smart trail to your charts via the settings in the “signals and overlays” indicator
- Add the dashboard to your charts, and make sure to set the correct signal “sensitivity” that it recommends
- Analyze the trend and major support/resistance zones on a high timeframe before looking at lower timeframes
- Calculate your risk/reward ratio before entering a trade
- Enter trades based on the 3 trade setups
- Set a stop loss for capital preservation, and scale out of your position by taking profits when you see “x” overlays.
- If you want your candles to look the ones in the examples, switch them to “Heikin Ashi”
That’s pretty much it!
Of course, you can use this in conjunction with traditional price analysis as well. Map out the major support/resistance lines, and pay attention to pattern formations. If you’re not familiar with basic price patterns, I suggest you print off a cheat sheet and keep it next to you while you’re trading.
You’ll quickly end up memorizing them if you do that.
Video Explanation
Important Disclaimer
You’re not going to have a 100% win rate (not even close), so drop those expectations. Even the best traders in the world frequently have losing trades.
The key to becoming a successful trader is to control your ego, and accept that the price isn’t always going to move in the direction you want.
That being said, you can be wrong more than half the time, yet still be profitable long term.
It all comes down to your risk management and trade selection.
In other words, use stop losses and enter trades that offer a good risk/reward ratio.
For example: If your average risk/reward ratio is 1:2, meaning that you’re risking 1% to make 2% on every trade, you’ll end up being profitable even if you’re stopped out 50% of the time.
Also, don’t put too much of your trading balance in any one single trade.
It’s commonly taught that you shouldn’t risk more than 2% of your portfolio in a single trade. However, that’s just a guideline. You can do what you’re comfortable with. If you’re just starting out with a small balance, then 2% might not even be worth your time.
Whatever you choose, I would however recommend that you start small, test the system and gain confidence before you start scaling up your position sizes.